Industry Standards for Software Sales: 2026 Benchmarks
संक्षेप में:
- Industry standards in software sales set benchmarking metrics such as commission rates, quota-to-OTE ratios, and pay splits to align sales incentives with revenue goals. Effective plans typically feature tiered accelerators, realistic quotas, and pay mixes matching sales cycle lengths to boost performance and retention. Building compensation around these benchmarks and ensuring proper handoffs and licensing compliance significantly improves revenue stability and growth.
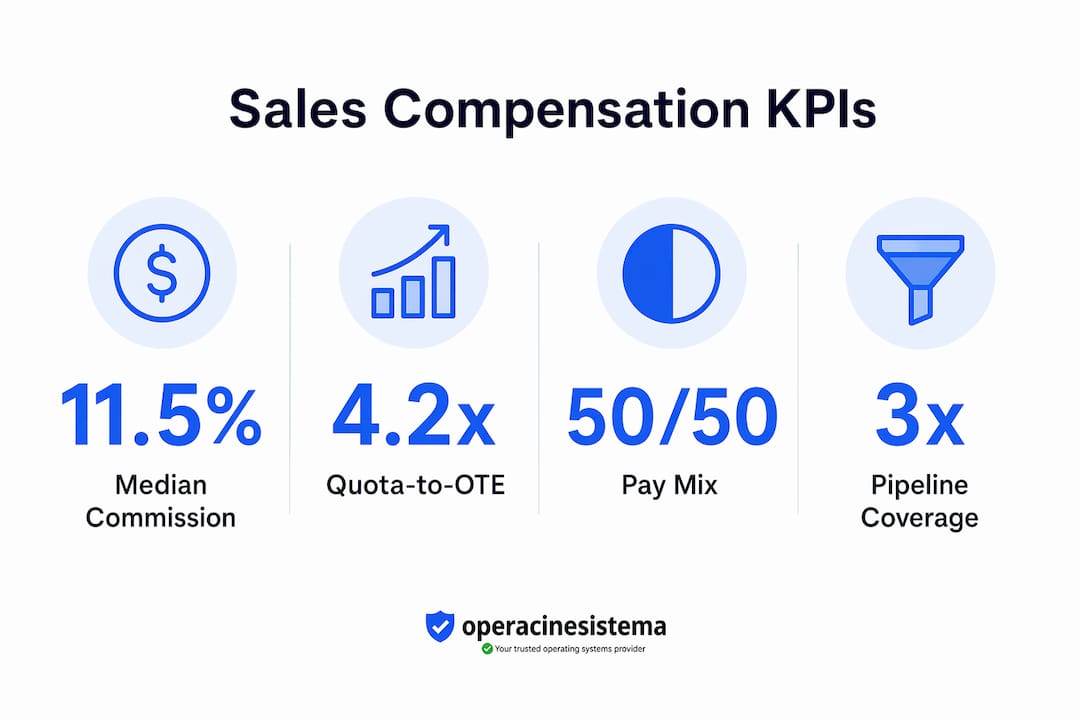
Industry standards for software sales are defined as the established benchmarks covering commission rates, quota-to-OTE ratios, and base-to-variable pay splits that align sales team incentives with company revenue goals. These standards exist because compensation design directly drives performance, retention, and predictability. In 2026, the median AE commission rate sits at 11.5% at 100% quota attainment. Benchmarking tools and research from Everstage, Qobra, and SyncGTM have made these numbers more transparent than ever. Whether you are a sales professional negotiating your package or a vendor designing a compensation plan, knowing these numbers is your starting point.

What are the standard commission rates and quota structures in software sales?
Commission rates in software sales are not one-size-fits-all. They vary by market segment, role, and deal size in ways that matter significantly to your take-home pay and your team’s revenue targets.
Commission rates by market segment
B2B software commission rates follow a clear tiered structure across segments:
| Segment | Commission Rate | Quota-to-OTE Ratio | Typical Pay Mix |
|---|---|---|---|
| SMB | 10–15% | 5–6x OTE | 50/50 |
| Mid-Market | 8–12% | 4–5x OTE | 50/50 |
| Enterprise | 5–8% | 3–4x OTE | 60/40 (base-heavy) |
| SDR (all segments) | 5–10% | विभिन्न | 70/30 or 60/40 |
Enterprise rates look lower, but the deal sizes are larger. A 6% commission on a $500,000 contract pays far more than a 14% rate on a $30,000 SMB deal.
Quota structures and OTE ratios
Quota-to-OTE ratios average 4.2x across software sales roles. That means an Account Executive with a $120,000 OTE typically carries a quota of roughly $500,000 in annual contract value. SMB roles run higher at 5–6x because deal velocity compensates for smaller deal sizes. Enterprise roles run lower at 3–4x because longer sales cycles and complex stakeholder maps make each deal harder to close.
Accelerator structures kick in above 100% quota attainment. Reps hitting 100–125% of quota typically earn 1.5x their base commission rate. Those exceeding 150% can trigger multipliers of 2x or higher. These accelerators are not bonuses. They are built into the plan architecture to reward overachievement and keep top performers from leaving.
प्रो टिप: Set quota targets where 60–70% of your team can realistically hit them. If fewer than 60% are attaining quota, your targets are too high. If more than 70% are hitting them easily, you are leaving revenue on the table.
How do base pay and variable compensation mixes align with software sales benchmarks?
The base-to-variable pay split is one of the most consequential decisions in compensation design. It determines how much financial risk a rep carries and how strongly their income ties to performance.
Standard pay mix by role
द industry standard for AEs is a 50/50 split between base salary and variable compensation. SDRs typically receive a 70/30 or 60/40 split, with a heavier base. The logic is straightforward: SDRs generate pipeline but do not close deals, so their income should not swing wildly based on factors outside their control.
Here is what the pay mix signals about each role:
- 50/50 AE split: High performance accountability. The rep owns the full sales cycle and earns accordingly.
- 60/40 AE split (enterprise): Longer sales cycles justify more base stability. Reps cannot close a six-month deal faster by working harder in week two.
- 70/30 SDR split: Lead generation is a volume game. Stability keeps SDRs focused on activity metrics rather than chasing commission.
- 80/20 or higher base: Typically reserved for customer success managers or account managers with renewal-focused roles.
Why sales cycle length changes everything
Pay mix should reflect the length and complexity of your sales motion. A rep selling a $2,000 SMB license in a two-week cycle can handle a 50/50 split because they close multiple deals per month. A rep selling a $400,000 enterprise contract over six months needs base stability to stay motivated through a long process with no guaranteed close.
Modern sales processes designed around buyer decision-making rather than rigid stage funnels also affect pay mix design. When deals move at the buyer’s pace, reps need enough base income to stay engaged without feeling financially pressured to rush the process.
प्रो टिप: If you are designing a compensation plan, match your pay mix to your average sales cycle length. Cycles under 30 days can support 50/50 or even 40/60 splits. Cycles over 90 days should lean toward 60/40 or 65/35 to prevent rep burnout and turnover.
What are the best practices for quota setting and pipeline management?
Quota setting is where most software sales organizations get into trouble. Set quotas too high and you burn out your team. Set them too low and you undershoot revenue targets. The best practices below come directly from 2026 industry data.
Quota attainment as a team health metric
A healthy sales team sees 60–70% of reps hitting or exceeding quota in any given period. This range is the clearest signal that your quota design is working. Below 60% means your targets are unrealistic. Above 70% means you set the bar too low and your top performers are not being stretched.
Quota-to-OTE ratios above 6x are a red flag. Reps carrying quotas that are more than six times their OTE face targets that are statistically difficult to achieve. The result is higher turnover, lower morale, and a culture where reps stop trusting the plan.
Pipeline coverage benchmarks
Qualified pipeline coverage of 3x quota is the benchmark that predicts revenue success. Total pipeline coverage is a less reliable metric because it includes deals that will never close. Tracking only qualified pipeline forces your team to apply real qualification criteria before counting a deal.
This is where frameworks like BANT (Budget, Authority, Need, Timeline) become critical. Using BANT before AE meetings can increase close rates by up to 202%. That is not a marginal improvement. It is the difference between a pipeline full of real opportunities and one full of wishful thinking.
Best practices for quota and pipeline management
- Set quotas using historical attainment data, not top-performer outliers.
- Review quota-to-OTE ratios quarterly and adjust when market conditions shift.
- Track qualified pipeline separately from total pipeline in your CRM.
- Require BANT or a similar qualification framework before deals enter the active pipeline.
- Conduct formal account handoffs between Sales and Customer Success at close.
- Use pipeline coverage reports to flag reps who are under 3x coverage before the quarter ends.
- Tie pipeline reviews to weekly one-on-ones so managers can coach in real time.
Structured account handoffs between Sales and Customer Success reduce first-year churn by 25–40% when treated as formal protocols rather than informal emails. This single practice protects revenue you have already earned.
How do accelerators, SPIFFs, and commission caps affect sales performance?
Accelerators and SPIFFs are the tools that separate a good compensation plan from a great one. They drive overachievement, reward top performers, and focus the team on strategic priorities. Commission caps do the opposite.
Tiered accelerator structures
| Quota Attainment | Accelerator Multiplier | Effective Commission (Base 10%) |
|---|---|---|
| 0–99% | 1.0x | 10% |
| 100–125% | 1.5x | 15% |
| 126–150% | 2.0x | 20% |
| 150%+ | 2.5x–5.0x | 25–50% |
Tiered accelerators at 1.5x to 2x above quota are the single most effective lever for retaining top performers and driving overachievement. Plans with accelerators consistently outperform capped plans on both revenue velocity and rep retention.
The real cost of commission caps
Commission caps feel like a cost control measure. They are actually a retention risk. When a top performer closes a deal that would have earned them $40,000 in commission but hits a cap at $25,000, they notice. They start looking at competitors. The cost of replacing a top AE, including recruiting, onboarding, and ramp time, typically exceeds $100,000. Caps save you $15,000 and cost you $100,000.
SPIFFs and strategic incentives
SPIFFs (Sales Performance Incentive Funds) are short-term cash bonuses tied to specific objectives. Common uses include pushing a new product line in Q1, clearing end-of-quarter inventory, or accelerating deals in a specific vertical. A well-designed SPIFF runs for 30–60 days and pays out within two weeks of the qualifying event. Delayed payouts kill the motivational effect entirely.
The key rule for SPIFFs: tie them to behaviors you can measure, not outcomes you hope for. “Close three deals in the healthcare vertical this month” is a good SPIFF. “Help us hit our Q2 number” is not.
मुख्य बातें
Effective software sales compensation requires matching commission rates, quota-to-OTE ratios, and pay mix splits to your specific market segment and sales motion to drive performance and retention.
| बिंदु | विवरण |
|---|---|
| Commission rates vary by segment | SMB pays 10–15%, mid-market 8–12%, and enterprise 5–8% based on deal size and cycle length. |
| 50/50 is the AE standard | Account Executives typically split base and variable equally; SDRs lean 70/30 for stability. |
| Quota attainment signals plan health | A healthy team sees 60–70% of reps hitting quota; outside this range, adjust targets. |
| 3x qualified pipeline is the benchmark | Track qualified pipeline at 3x quota, not total pipeline, for reliable revenue forecasting. |
| Accelerators beat caps every time | Tiered multipliers of 1.5x–2x above quota retain top performers better than any other tool. |
What I have learned designing software sales compensation plans
After working closely with software vendors and sales teams across SMB and enterprise segments, the pattern I see most often is this: companies design compensation plans that look correct on paper but fail in practice because they were built around what leadership wants, not what the market demands.
The most common mistake is setting quotas based on company revenue goals rather than rep capacity. I have seen teams where 80% of reps miss quota every quarter, and leadership responds by raising OTE instead of fixing the quota. That is backwards. When reps stop believing they can hit their number, the plan stops working regardless of how attractive the accelerators look.
The second mistake is treating the sales funnel as a rigid sequence of stages. Buyer-centric sales processes consistently outperform stage-gate funnels because they reflect how decisions actually get made. Stakeholder approval, budget cycles, and procurement timelines do not follow your CRM stages. Your process should follow them.
The third mistake is underinvesting in the Sales to Customer Success handoff. I cannot overstate how much revenue leaks through unstructured handoffs. The deal context, the champion’s priorities, the promises made during the sales cycle. All of it disappears in a one-line email. Formalizing this transfer with a structured document cuts churn risk meaningfully and protects the revenue your team worked hard to close.
My honest advice: build your compensation plan around the 60–70% attainment rule, remove commission caps, and invest in a real handoff protocol. Those three changes will do more for your revenue than any new sales methodology or CRM upgrade.
— Danielius
Licensing compliance matters as much as your sales process
If you sell software or manage a team that does, your sales process is only as strong as your licensing compliance. A deal that closes on non-genuine or improperly licensed software creates liability, churn, and reputational risk that no accelerator can fix.
Operacinesistema has built practical resources to help sales professionals and SMBs stay on the right side of licensing requirements. The SMB compliance checklist covers the exact steps your team needs to verify license validity before and after a sale. For a broader foundation, the essential licensing guide walks you through what genuine licensing looks like and why it matters for customer trust. Selling software the right way starts with understanding what you are actually selling.
अक्सर पूछे जाने वाले प्रश्न
What is the standard commission rate for software sales AEs?
The median commission rate for SaaS Account Executives is 11.5% at 100% quota attainment. Rates range from 10–15% for SMB, 8–12% for mid-market, and 5–8% for enterprise roles.
What quota-to-OTE ratio is considered healthy in software sales?
A healthy quota-to-OTE ratio averages 4.2x across software sales roles. Ratios above 6x signal unrealistic targets and increase rep turnover risk significantly.
What is the best pay mix for a software sales Account Executive?
The industry standard for AEs is a 50/50 base-to-variable split. Enterprise AEs sometimes use a 60/40 split to account for longer sales cycles and greater deal complexity.
How much qualified pipeline coverage should a software sales team maintain?
Sales teams should maintain qualified pipeline coverage of at least 3x their quota. This metric is more predictive of revenue success than total pipeline coverage because it filters out unqualified deals.
Do commission caps hurt software sales performance?
Yes. Commission caps reduce motivation for top performers and increase turnover risk. Plans with tiered accelerators consistently outperform capped plans on both revenue and rep retention.